





Forecasting customer support volume means estimating how many new customer needs will arrive in each period and expressing the answer as a range. Start with clean history, separate human-required demand from automation-only activity, add known events, and test the method on unseen periods.
The forecast does not need to predict every spike. It needs to be more useful than a simple average and clear enough that an operations lead can explain why staffing, shifts, or escalation coverage changed.
| Area | What to verify |
|---|---|
| Decide what counts as demand | Choose one unit before opening a spreadsheet. For most support teams, the useful unit is a newly created conversation or case that represents one customer need. |
| Use two planning horizons | A monthly or weekly forecast helps with hiring, leave, and campaigns. A daily or interval forecast helps with shifts, breaks, and live queues. One model rarely serves both decisions equally well. |
| Build a baseline the team can explain | Begin with a transparent baseline before considering complex software. For each weekday or operating interval, take the median arrival volume from recent comparable weeks. |
| Add known events without hiding them | Maintain a small event ledger for launches, campaigns, billing dates, planned maintenance, public holidays, and product retirements. |
Decide what counts as demand
Choose one unit before opening a spreadsheet. For most support teams, the useful unit is a newly created conversation or case that represents one customer need. It is not every inbound message, agent reply, notification, or status change.
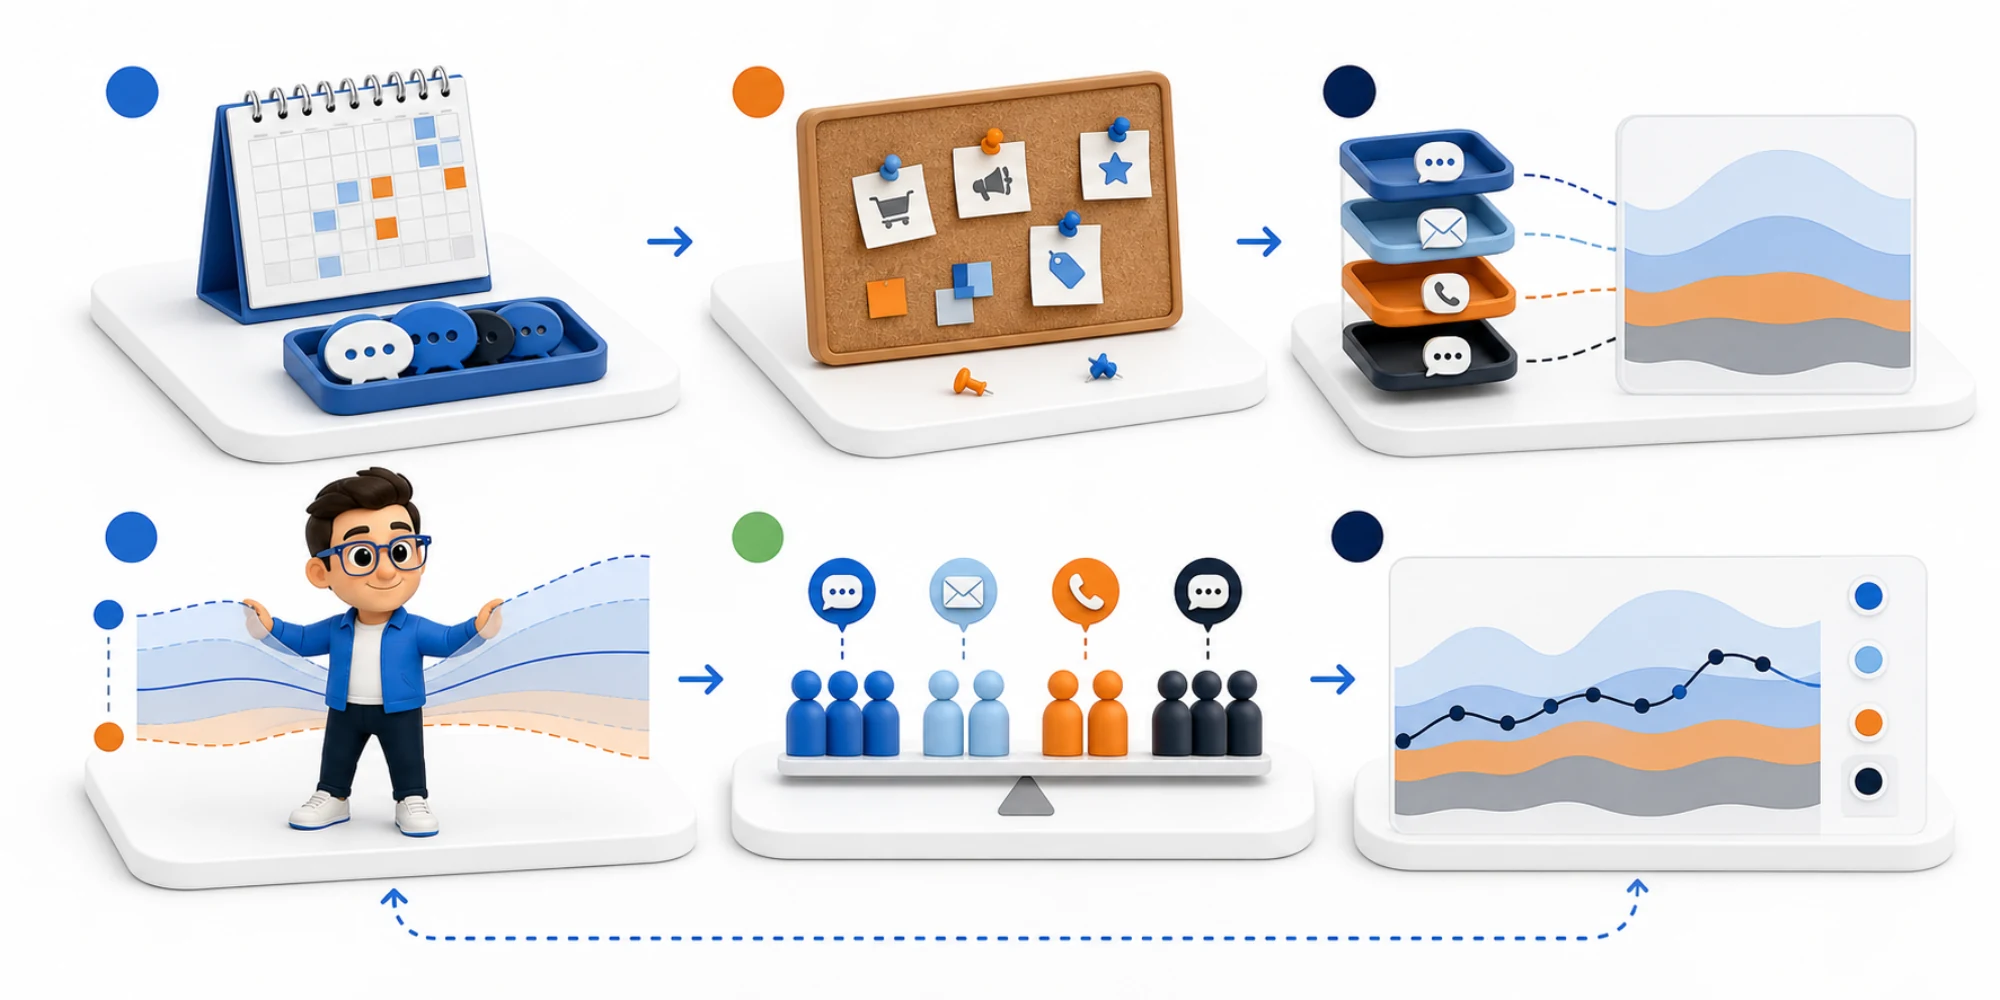
This prevents long conversations from inflating arrival volume. A ten-message exchange and a two-message exchange may each be one arrival, although they create different workloads. Keep volume and handling effort separate.
Mark conversations that automation resolves without human work. Microsoft’s service forecasting guidance excludes conversations handled entirely by AI from the forecast used for human staffing. Forecast total customer demand and human-required demand separately so automation changes do not look like disappearing customer interest.
Remove test records, confirmed spam, duplicate cases, and system-generated noise using a documented rule. Do not silently remove difficult conversations or abandoned contacts. If abandonment matters to the operation, report it as its own series and decide whether a person could have prevented it.
Use two planning horizons
A monthly or weekly forecast helps with hiring, leave, and campaigns. A daily or interval forecast helps with shifts, breaks, and live queues. One model rarely serves both decisions equally well.
Build a daily view several weeks or months ahead. Then build a near-term view by the interval your operation can act on, such as 30 or 60 minutes. Microsoft supports separate daily and 15-minute forecasts for similar reasons. Choose a smaller interval only when the data is dense enough and managers can actually change coverage at that speed.
Keep channel and queue detail where it changes staffing. A total of 300 arrivals is not sufficient if 200 are asynchronous and 100 require immediate attention. Forecasting every tag separately creates unstable noise. Split groups only when each has enough history and a different operating response.
Build a baseline the team can explain
Begin with a transparent baseline before considering complex software. For each weekday or operating interval, take the median arrival volume from recent comparable weeks. A median is less distorted by a single outage or promotion than a mean.
Use complete weeks that reflect the current service setup. Do not blend months before a new channel existed with its current pattern. Record coverage gaps, routing changes, and exclusions beside the forecast.
Seasonality should be visible, not mysterious. Compare Mondays with Mondays, relevant holidays with similar holidays, and recurring billing or delivery dates with their normal position in the month. Microsoft’s guidance supports holiday calendars and forecasts by queue or channel, while also warning that unexpected trends can make a forecast inaccurate.
A useful baseline might be no more complicated than this process:
- Count valid new conversations by day and channel.
- Select the most recent comparable weeks.
- Calculate the median for each weekday or interval.
- Preserve the raw baseline before adding judgment.
Add known events without hiding them
Maintain a small event ledger for launches, campaigns, billing dates, planned maintenance, public holidays, and product retirements. Zendesk’s workforce forecasting guidance explicitly allows adjustments for events such as marketing campaigns and feature sunsets.
Record the event name, affected queue, start and end, expected change, evidence, owner, and date of the assumption. Add the adjustment to the baseline instead of editing the history. After the event, record the actual lift and reuse it only when the next event is genuinely comparable.
Avoid false precision. If the last two launches increased conversations by different amounts, plan a low, base, and high effect. An honest range is more actionable than a single number with an unexplained decimal.
Backtest before trusting the forecast
Pretend that several past weeks are still in the future. Build each forecast using only information available before that week, then compare it with what arrived. This walk-forward test exposes methods that look accurate only because they accidentally use later information.
Track absolute error, which shows how far the forecast missed, and bias, which shows whether it repeatedly forecasts too high or too low. Review error by channel and queue, not only in the total. Opposite errors can cancel each other and make the overall result look better than the staffing experience.
Compare the chosen method with the weekday median. Complexity earns its place only if it improves decisions consistently. Recheck after a routing change, channel launch, automation rollout, or sustained behavior shift.
Plan a range and decide in advance
Publish a low, base, and high forecast with the assumptions behind each. Microsoft presents lower and upper confidence bounds around its forecasts; even a manual process benefits from the same habit of showing uncertainty.
Attach an action to each range. The base plan might set normal shifts. The high plan might delay nonurgent internal work, extend overlap between shifts, or name an overflow owner. The low plan might preserve training time. Agree on the trigger before the queue is busy.
Turn volume into a staffing decision
Arrivals are only one input. Convert the forecast into work by combining it with observed effort, concurrency, service targets, schedule coverage, and shrinkage such as meetings or leave. Do this separately for work classes that behave differently.
The companion guide to support agent conversation capacity explains how to measure safe active load. Use that capacity evidence with the arrival range instead of relying on a universal conversations-per-agent ratio.
In DripTell’s shared inbox, teams can keep channel, ownership, status, tags, and customer context beside each conversation. Consistent fields help create a cleaner demand history. Start with a weekly review, record every assumption, and let forecast error change the next plan.
Frequently Asked Questions
How much historical data is needed for a support forecast
Use enough comparable history to reveal weekday and seasonal patterns without reaching into an obsolete operating model. Several complete recent weeks support an initial baseline. Longer history helps with annual holidays if channel, routing, and data definitions stayed comparable.
Should automated conversations count in the forecast
Count them in total customer demand, but separate conversations resolved entirely by automation from demand requiring a person. This shows whether customer interest changed and prevents an automation rollout from distorting the human staffing forecast.
How often should a support forecast be updated
Refresh near-term forecasts at least weekly and whenever a material event changes demand or capacity. Review longer-range forecasts monthly. Rebuild the baseline after sustained changes in channels, routing, automation, customer behavior, or data quality.
Want help applying this guide?Ask the DripTell team
From reading to action
Want help applying this to your business?
Share your details. We will read the article you are on and start with a useful answer for your team.
DripTell Editorial
Practical guidance reviewed by the DripTell product and customer workflow team.
See how DripTell checks product claims, uses primary sources and handles corrections.
Editorial and source policy